 BDT GeoCatalogue
Type of resources
Available actions
Topics
Keywords
Contact for the resource
Provided by
Years
Formats
Representation types
Update frequencies
status
Service types
Resolution
-
-
The G5 Accelerator brings together high-value tools and resources offering practical, step-by-step support for countries already embarked or planning to embark on their digital transformation journey. Discover the gold standard for collaborative digital policy and regulation.
-
-
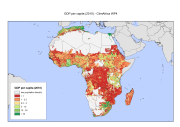
The Gross Domestic Product per capita (gross domestic product divided by mid-year population converted to international dollars, using purchasing power parity rates) has been identified as an important determinant of susceptibility and vulnerability by different authors and used in the Disaster Risk Index 2004 (Peduzzi et al. 2009, Schneiderbauer 2007, UNDP 2004) and is commonly used as an indicator for a country’s economic development (e.g. Human Development Index). Despite some criticisms (Brooks et al. 2005) it is still considered useful to estimate a population’s susceptibility to harm, as limited monetary resources are seen as an important factor of vulnerability. However, collection of data on economic variables, especially sub-national income levels, is problematic, due to various shortcomings in the data collection process. Additionally, the informal economy is often excluded from official statistics. Night time lights satellite imagery of NOAA grid provides an alternative means for measuring economic activity. NOAA scientists developed a model for creating a world map of estimated total (formal plus informal) economic activity. Regression models were developed to calibrate the sum of lights to official measures of economic activity at the sub-national level for some target Country and at the national level for other countries of the world, and subsequently regression coefficients were derived. Multiplying the regression coefficients with the sum of lights provided estimates of total economic activity, which were spatially distributed to generate a 30 arc-second map of total economic activity (see Ghosh, T., Powell, R., Elvidge, C. D., Baugh, K. E., Sutton, P. C., & Anderson, S. (2010).Shedding light on the global distribution of economic activity. The Open Geography Journal (3), 148-161). We adjusted the GDP to the total national GDPppp amount as recorded by IMF (International Monetary Fund) for 2010 and we divided it by the population layer from Worldpop Project. Further, we ran a focal statistics analysis to determine mean values within 10 cell (5 arc-minute, about 10 Km) of each grid cell. This had a smoothing effect and represents some of the extended influence of intense economic activity for local people. Finally we apply a mask to remove the area with population below 1 people per square Km. This dataset has been produced in the framework of the "Climate change predictions in Sub-Saharan Africa: impacts and adaptations (ClimAfrica)" project, Work Package 4 (WP4). More information on ClimAfrica project is provided in the Supplemental Information section of this metadata.
-
Published by Collins Bartholomew in partnership with Global System for Mobile Communications (GSMA), the Mobile Coverage Explorer is a raster data representation of the area covered by mobile cellular networks around the world. Data_MCE global coverage has been sourced from the network operators and created from submissions made directly to Collins Bartholomew or to GSMA, from operators who provide roaming detail for inclusion in the GSMA’s Network Coverage Maps web application (https://www.gsma.com/coverage). The dataset is provided at Global and National level. Global datasets contain the merged global coverages with the following file naming convention. MCE_Global<Technology>_<DataRelease>, where technology is ‘4G’. At country level the rasters depict the network coverage in each country for each technology. Therefore a country is not defined by its border extent but rather by the coverage supplied by network operators with licences in that country. In the file naming convention, countries are identified using their ISO 3166-1 code as follows: MCE_<ISO2Code><Technology>_<DataRelease>. The cell value in the MCE rasters are as follows: 1 - strong signal 2 - variable signal strength This data is supplemented with coverage created from OpenCellID (please see link in the associated resources of this metadata).
-
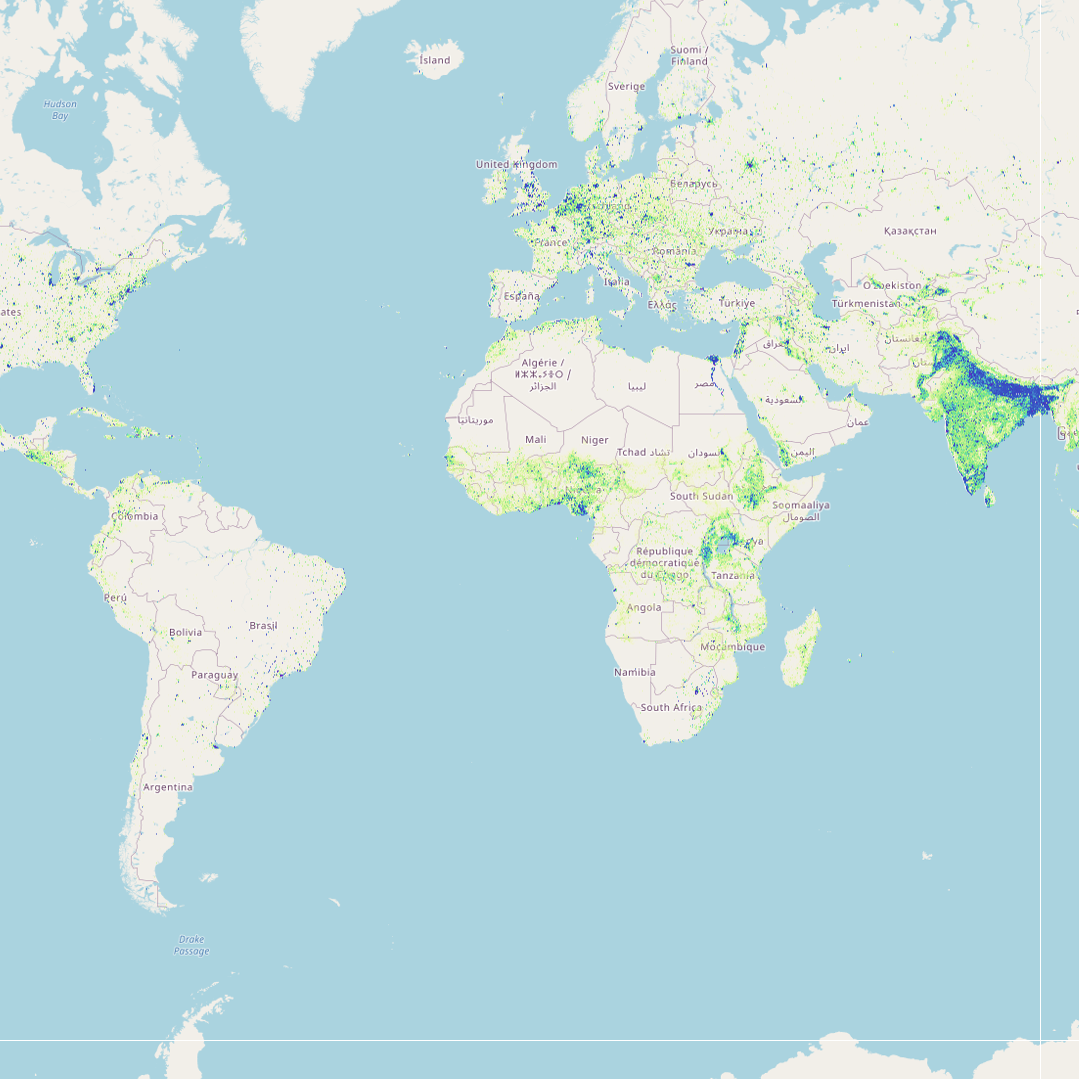
Estimated density of people per grid-cell, approximately 1km (0.008333 degrees) resolution. The units are number of people per Km² per pixel, expressed as unit: "ppl/Km²". The mapping approach is Random Forest-based dasymetric redistribution. The WorldPop project was initiated in October 2013 to combine the AfriPop, AsiaPop and AmeriPop population mapping projects. It aims to provide an open access archive of spatial demographic datasets for Central and South America, Africa and Asia to support development, disaster response and health applications. The methods used are designed with full open access and operational application in mind, using transparent, fully documented and peer-reviewed methods to produce easily updatable maps with accompanying metadata and measures of uncertainty. Acknowledgements information at https://www.worldpop.org/acknowledgements
-
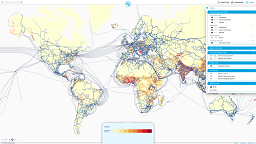
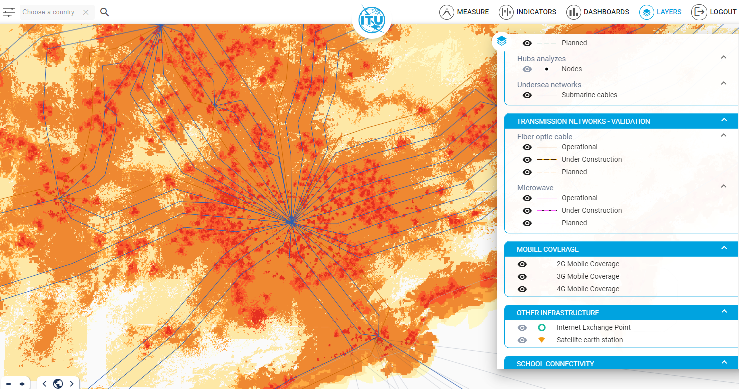
ITU Transmission Networks WMS enabled from the ITU Broadband Mapping programme (BBmaps) and related research. Terrestrial backbone connectivity (optical fibres, microwaves). The data for the World Transmission Links have been collected through: Primary sources: Reply to an official request for information (RFI) document has been sent to all Regions outlining the purpose of the project for operators, indicating what level of detail is required, and what format the data is to be published. Secondary sources: On data was readily available in the public domain, from operator websites, annual reports, company presentations, and presentations at industry conferences. Partnership: A number of organizations do already research and produce transmission network maps for particular countries or regions, for various technical reasons. The collection of data as well as their validation from concerned Operators/Administrations is currently a work in progress. This layer Includes extracts and a simplified metadata from the research conducted by ITU on backbone fibre and microwave links. For more information: https://bbmaps.itu.int.
-
-

-

The world’s richest source of ICT statistics and regulatory information. Track the digital transformation with the ITU DataHub, featuring hundreds of ICT indicators on connectivity, markets, affordability, trust governance, and sustainability. Find, compare, and download data for nearly 200 economies.