 BDT GeoCatalogue
GDP
Type of resources
Available actions
Topics
Keywords
Contact for the resource
Provided by
Years
Representation types
Update frequencies
status
Resolution
-
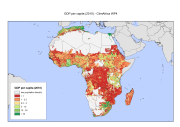
The Gross Domestic Product per capita (gross domestic product divided by mid-year population converted to international dollars, using purchasing power parity rates) has been identified as an important determinant of susceptibility and vulnerability by different authors and used in the Disaster Risk Index 2004 (Peduzzi et al. 2009, Schneiderbauer 2007, UNDP 2004) and is commonly used as an indicator for a country’s economic development (e.g. Human Development Index). Despite some criticisms (Brooks et al. 2005) it is still considered useful to estimate a population’s susceptibility to harm, as limited monetary resources are seen as an important factor of vulnerability. However, collection of data on economic variables, especially sub-national income levels, is problematic, due to various shortcomings in the data collection process. Additionally, the informal economy is often excluded from official statistics. Night time lights satellite imagery of NOAA grid provides an alternative means for measuring economic activity. NOAA scientists developed a model for creating a world map of estimated total (formal plus informal) economic activity. Regression models were developed to calibrate the sum of lights to official measures of economic activity at the sub-national level for some target Country and at the national level for other countries of the world, and subsequently regression coefficients were derived. Multiplying the regression coefficients with the sum of lights provided estimates of total economic activity, which were spatially distributed to generate a 30 arc-second map of total economic activity (see Ghosh, T., Powell, R., Elvidge, C. D., Baugh, K. E., Sutton, P. C., & Anderson, S. (2010).Shedding light on the global distribution of economic activity. The Open Geography Journal (3), 148-161). We adjusted the GDP to the total national GDPppp amount as recorded by IMF (International Monetary Fund) for 2010 and we divided it by the population layer from Worldpop Project. Further, we ran a focal statistics analysis to determine mean values within 10 cell (5 arc-minute, about 10 Km) of each grid cell. This had a smoothing effect and represents some of the extended influence of intense economic activity for local people. Finally we apply a mask to remove the area with population below 1 people per square Km. This dataset has been produced in the framework of the "Climate change predictions in Sub-Saharan Africa: impacts and adaptations (ClimAfrica)" project, Work Package 4 (WP4). More information on ClimAfrica project is provided in the Supplemental Information section of this metadata.