 BDT GeoCatalogue
service
Type of resources
Available actions
Keywords
Contact for the resource
Provided by
Years
status
Service types
-
The G5 Accelerator brings together high-value tools and resources offering practical, step-by-step support for countries already embarked or planning to embark on their digital transformation journey. Discover the gold standard for collaborative digital policy and regulation.
-
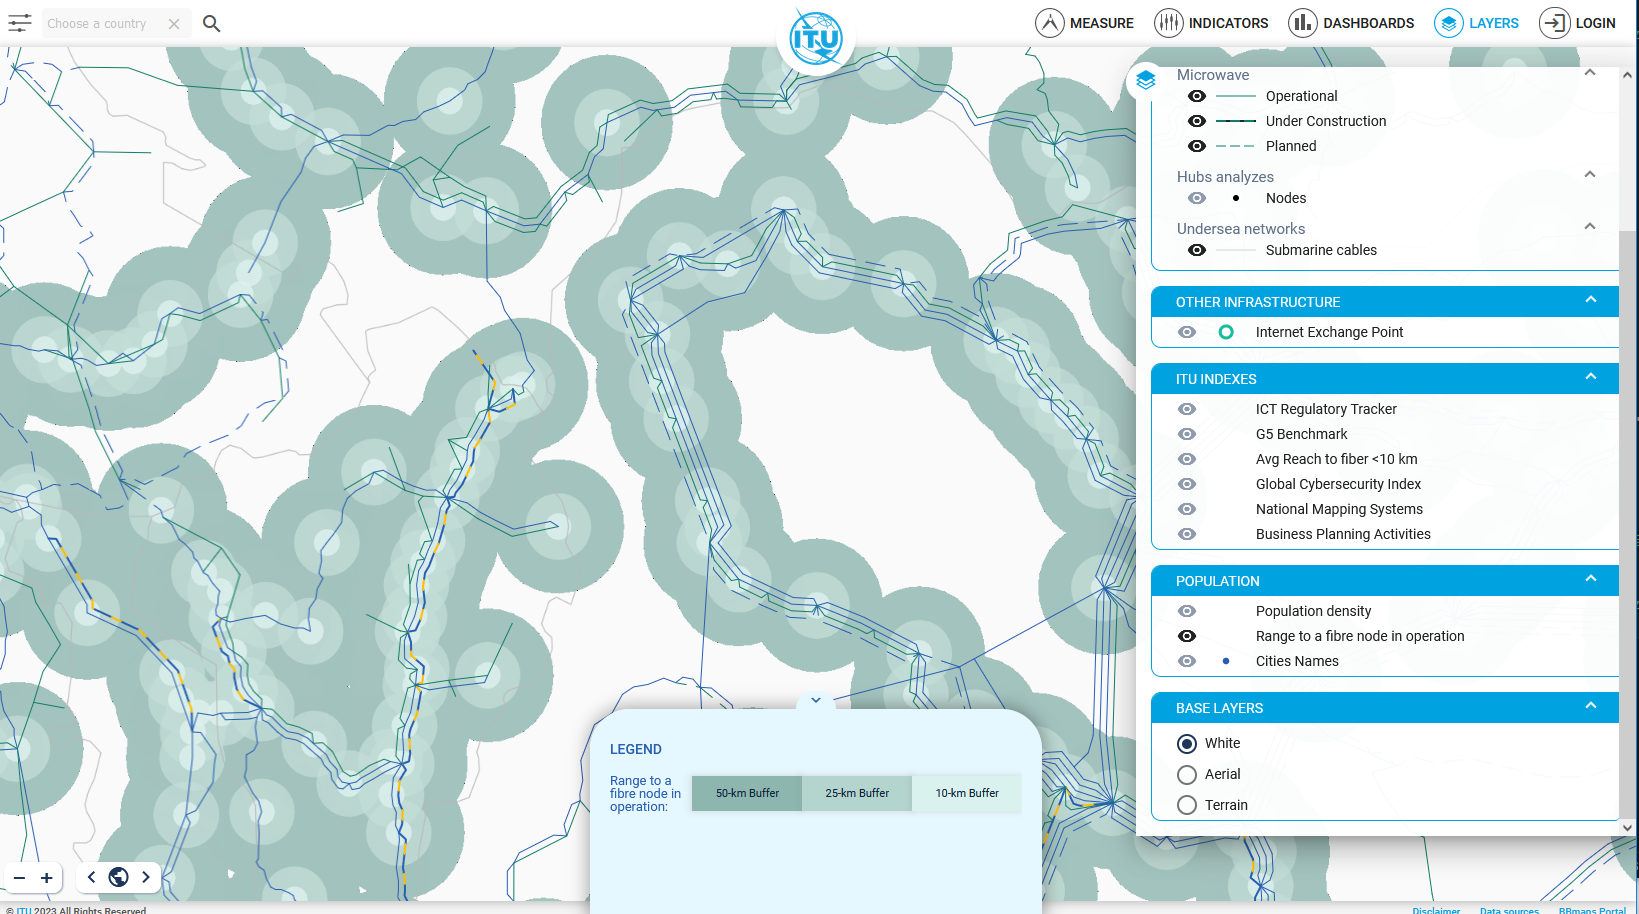
Range to a Fibre Notes (Access Points) layers from the ITU Broadband Mapping programme (BBmaps) and research The layer displays 10, 25 and 50 km of distance to a Fibre Node. This is used to calculate the Broadband Capacity Indicator 7 (Percentage of population within reach of transmission networks) The population living within reach of transmission networks is calculated from network nodes (points) rather than routes (lines), because nodes are access points to the network. This is the equivalent of a motorway: a motorway may pass through areas of high and low population density, but the only means of accessing the motorway are at junctions
-
Getting Started: The Data Catalog is designed to make World Bank's development data easy to find, download, use, and share. It includes data from the World Bank's microdata, finances and energy data platforms, as well as datasets from the open data catalog. There are different ways to access and download datasets. What is Data Catalog? The Data Catalog is a project to provide a more effective means for capture, acquisition, curation, access and use of development-Data Catalog data throughout the World Bank Group. The goal is to maximize the value and investment in data by increasing the potential for the data to be shared and reused, to minimize transaction costs in finding relevant data and data methodologies, and to prevent duplication. The project builds on existing expertise and resources such as the Microdata Library,Open Data Catalog and GFDRR. The Data Catalog provides a “One-Stop Shop” for development data produced, acquired or used by the World Bank in accordance with the Bank Procedure for Development Dataset Acquisition, Archiving and Dissemination, and the Guidance on Data Acquisition and Archiving. This includes metadata for datasets from other catalogs such as the Microdata Library, EnergyData.Info, Finances and World Bank Open Data API. Where needed, the Data Catalog also serves as a data storage repository, providing long-term storage for World Bank development data.
-
ITU Transmission Networks WMS enabled from the ITU Broadband Mapping programme (BBmaps) and related research. Terrestrial backbone connectivity (optical fibres, microwaves). The data for the World Transmission Links have been collected through: Primary sources: Reply to an official request for information (RFI) document has been sent to all Regions outlining the purpose of the project for operators, indicating what level of detail is required, and what format the data is to be published. Secondary sources: On data was readily available in the public domain, from operator websites, annual reports, company presentations, and presentations at industry conferences. Partnership: A number of organizations do already research and produce transmission network maps for particular countries or regions, for various technical reasons. The collection of data as well as their validation from concerned Operators/Administrations is currently a work in progress. This layer Includes extracts and a simplified metadata from the research conducted by ITU on backbone fibre and microwave links. For more information: https://bbmaps.itu.int.
-
The world’s richest source of ICT statistics and regulatory information. Track the digital transformation with the ITU DataHub, featuring hundreds of ICT indicators on connectivity, markets, affordability, trust governance, and sustainability. Find, compare, and download data for nearly 200 economies.
-
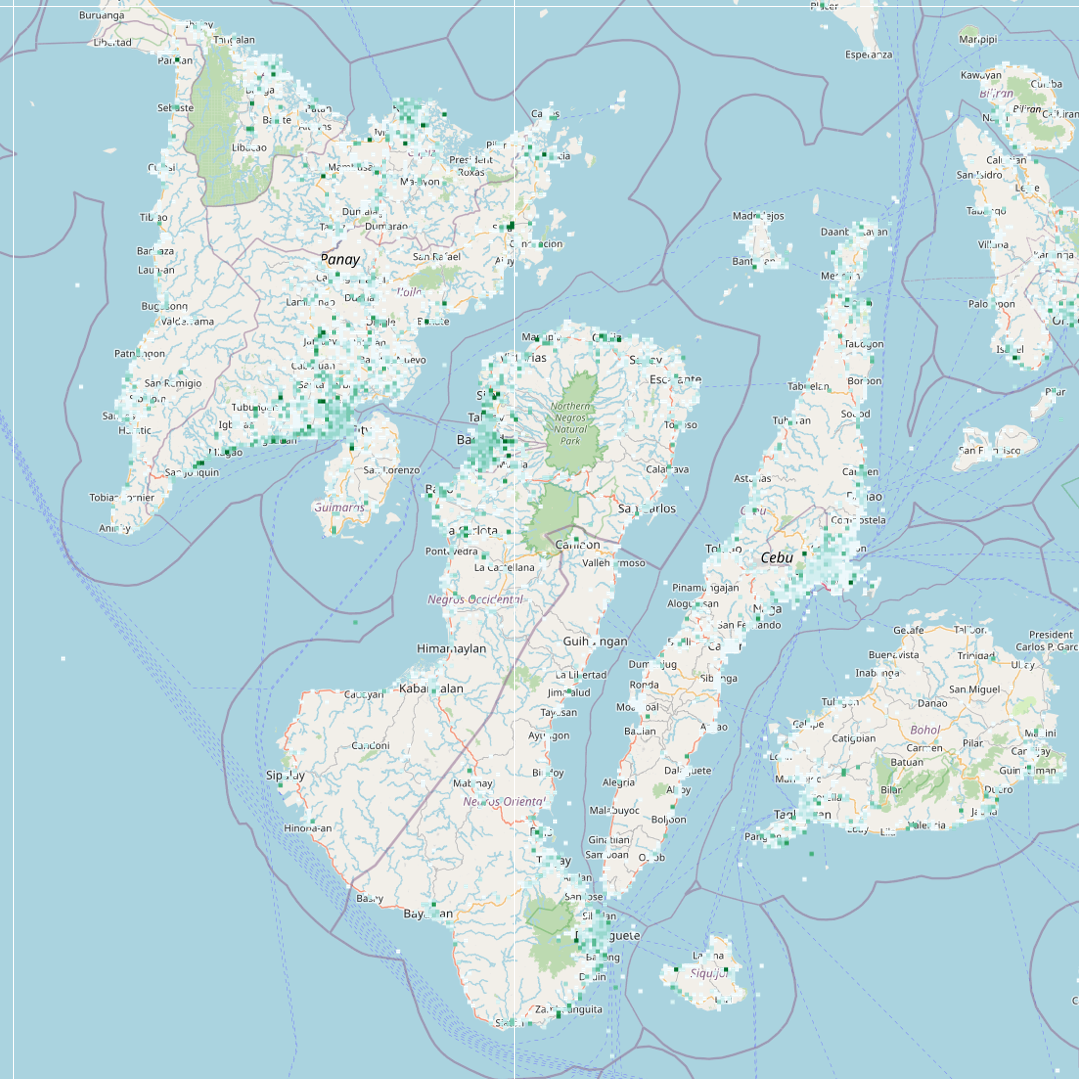
Disaster Connectivity Map (DCM) Connectivity is a map layer of performance, that compiles quality of service (Qos) measurements received via third party providers from software probes installed on end-user devices. The measurements received from SpeedChecker are ping (Ms), download speed (Mbps) and upload speed (Mbps), which are processed into point grid cells of 100-km, 10-km, 1-km, and 100-m which are displayed at different zoom levels depending on scale that the map is zoomed to. The default style (‘point_download’) displays download speed from the ‘download’ attribute field, but changing the style to the ‘ping’ (‘point_ping’) or ‘upload’ (‘point_upload’) fields will display these indicators. DCM Connectivity is a rolling worldwide baseline map layer of measurement data, in which all data received is added cumulatively and the median average for each measurement is recalculated each time it is updated. When the DCM is in active mode, the DCM Connectivity map layer is updated hourly. This map layer does not have a time dimension or time field, so cannot be filtered by time.